A Solubility Study on the Maybridge Ro3 (1000) and Ro3 (500) Drug Discovery Fragment Libraries
Figure 3.
Integrity vs.
visual data. |
 |
Introduction
In the maturing field of fragment-based drug discovery there is an increasing need for access to fragments of the highest quality1. Whilst structural and pharmacophysical properties are still the key attributes when selecting compounds to screen, the question of fragment solubility is an increasingly important factor for researchers and practitioners to consider.
Whilst there are several solubility prediction tools available, most of these have been based on the drug-like molecules which fit Lipinski’s rules. When the same calculations are applied to smaller fragment-like molecules these tools are much less reliable. Therefore, a study was carried out to experimentally assess the solubility of each member of the Maybridge Rule of Three (Ro3) ‘1000’ and ‘500’ compliant libraries2. The Cole-Parmer® Integrity 10 Reaction Station with its supplied data handling software allowed for 100 to 200 experiments to be run per day (depending on the protocol), providing data on compound solubility in both DMSO and aqueous phosphate buffer.

Developed in collaboration with partners at Pfizer and the Illinois Institute of Technology, the Integrity 10 Reaction Station with integrated software is a powerful tool for determining solubility and crystallization profiles. Precise heating and data collection of up to 10 reactor cells in parallel provides rapid measurement of solubility under a range of conditions, whilst individual infrared transmission detectors allow turbidity/solubility measurements to be performed to a standardized endpoint (threshold).
Solubility protocol
A solubilization protocol was designed to be representative of the techniques used by fragment screening practitioners and returns a definitive “soluble” or ”insoluble” result for each fragment at the following concentrations:
- 200 mM DMSO
- 5 mM aqueous buffer (containing 2.5% DMSO)
- 1 mM aqueous buffer (containing 0.5% DMSO)
The experimental conditions were engineered to incorporate a three-stage warming/cooling cycle to maximize the chances for dissolution and mirror techniques often used for screening sample preparation.
- Warm from 25 ºC to 40 ºC over 3 mins
- Hold at 40 ºC for 2 mins
- Cool from 40 ºC to 25 ºC over 3 mins
The choice of buffer and concentration is driven by developments in the field where practitioners opt for the convenience of DMSO stock for throughput purposes and increased solubility in aqueous systems. The aqueous buffer, 20 mM phosphate (adjusted to pH 7.5), is widely used in fragment sample preparation and screening as it is both NMR transparent and at the optimal concentration able to provide pH control, whilst not promoting unwanted salting effects.
Results
A series of validation tests were performed to attune the arbitrary transmission scale to a visual “pass”. The value of 78 ATU (Arbitrary Transmission Units) was found to be the optimal threshold value for the study, above which the sample was soluble.

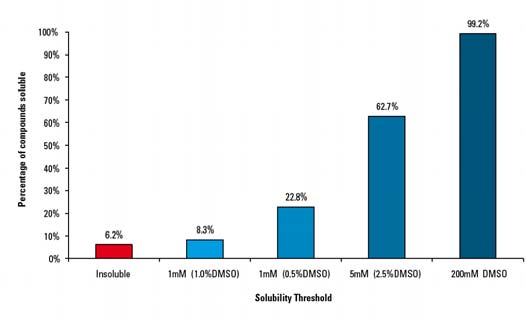
Figure 2. Ro3 (1000) solubility profile
The initial phase of the study, where solubility in DMSO at 200 mM was assessed, confirmed that >99% of the 1000 compounds tested were experimentally soluble. The insoluble compounds were either salts which subsequently dissolved in aqueous buffer or one of three compounds which had decomposed; compounds which were immediately removed from the library.
The 200mM DMSO solutions were used as stock for aqueous dilution to either 5 mM or 1 mM. The concentration of DMSO ranged from 2.5% to 0.5% depending on dilution. It was found that 94% of the 1000 Ro3 compounds were experimentally soluble at ≥1 mM with the majority soluble at ≥5 mM (62%) (see Figure 2). Only 26 compounds required heat (40 ºC) for dissolution.
The study found 62 compounds which were insoluble under the protocol conditions. These compounds were replaced with structurally similar, Ro3 compliant alternatives whose aqueous solubility had been experimentally assured.
Validation and Data Analysis
As part of the study a visual check was made for each sample to assess the accuracy of the Integrity 10 Reaction Station and the validity of the results obtained by applying a fixed transmission endpoint.
When viewed graphically (Figure 3, where red/pink are insoluble and green/light green are soluble) the two sets of data for solubility assessment at 5mM show good correlation (96.9%).
Closer visual inspection of those outlying samples where a negative visual result/positive transmission result was obtained, showed that macro-aggregation or “oiling” was the cause. The reasons are less clear when a positive visual result/negative transmission result was obtained and further investigation is needed for these cases.
Conclusion
The transmission data from the Integrity 10 has been validated against the observed data and has been shown to be 97% accurate. The high correlation between the visual and instrumental data allows rapid generation of solubility data to a standardized endpoint whilst removing the subjective aspect of a purely visual assessment.
References
- M. Congreve et al; J. Med. Chem., 2008, 51, 12, 3661-3680.
- D. C. Rees et al; Nature Reviews Drug Discovery, 2004, 3, 8, 660-672.


